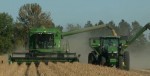
(Seeking Alpha) – The Thanksgiving holiday is next week, and that means that the harvest season in the United States and other countries in the northern hemisphere is over. The 2019 crop year is now in the books, and once again, production and crop yields were sufficient to satisfy global demand.
The weather conditions around the world are always the primary factor each year when it comes to the path of least resistance of prices. However, in 2019, the trade war between the US and China was a significant issue that faced agricultural markets.
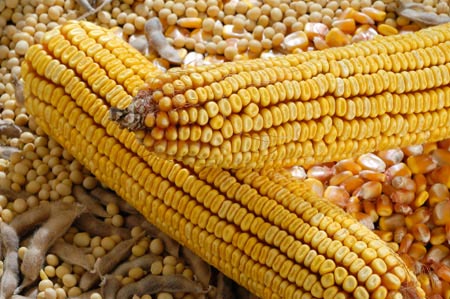
The United States is the world’s leading producer and exporter of soybeans and corn to the world. In past years, China purchased around one-quarter of the annual US soybean crop and plenty of corn. However, tariffs and retaliatory measures caused the Chinese to refrain from purchasing US oilseeds and other agricultural commodities, leading to glut conditions. Moreover, the outbreak of African swine fever in China that killed millions of pigs reduced Chinese demand for soybeans. The oilseed is the primary ingredient in animal feed.
As farmers now begin to make plans for the coming year, they will decide which crops to plant on their acreage for 2020. They will be watching the soybean and corn futures markets as they often have a choice between the two products during the spring planting season. Now is the right time to start watching the price action and differentials in corn and beans for the next harvest season.
The Teucrium Soybean ETF product (SOYB) and the Teucrium Corn ETF product (CORN) do excellent jobs replicating the price action in the oilseed and grain.
Each year is a new adventure in grain markets
The 2019 crop year in the United States just ended. With the cold winter months ahead, the 2020 planting, growing, and harvest seem way off in the distance. Sometime after New Year’s Day, farmers across the fertile plains of the United States will begin making plans for their acreage. The futures market allows for hedging activities so farmers can take advantage of price volatility to lock in favorable prices for crops before the seeds go into the ground.
Each year is always a new adventure when it comes to agricultural commodities as the weather conditions during a crop year is the most significant factor when it comes to the ultimate yields. The weather from April through October 2020 across the grain belt of the US will remain a mystery over the next six months. However, the one constant in the world of agricultural commodities is that the demand side of the fundamental equation continues to grow each day. Each quarter, the global population grows by around 20 million people. By the time the next crops begin to grow, there will be forty million more mouths to feed around the globe bringing the total to the 7.65 billion level according to the US Census Bureau.
The trade war has weighed on agricultural commodities
The growing population continues to underpin the demand side of the fundamentals for the corn and soybean markets. The weather is always a leading factor each year when it comes to the path of prices. Since 2018, the ongoing trade war between the US and China has added another dimension to the grain markets. Tariffs and retaliatory protectionist measures tend to distort prices. A trade war can create gluts in one part of the world and deficits in others. Since China stopped buying agricultural products from the US, supplies grew in American and declined in the Asian nation.
Soybean and corn prices have been moving higher during periods when optimism over a resolution to the trade war increased, and lower when the conflict escalated. In early August, when the US slapped new tariffs on China and the Chinese retaliated corn and soybean prices fell.
Any developments in the trade war will drive prices of corn and beans over the coming months. We have been in a period of optimism over the past weeks as both sides are working towards a “phase one” deal that could include agricultural commodities to flow from the US to China. However, each side has not signed any agreement, and we could still see the current optimism shift to pessimism, as we witnessed in early August, once again.
Farmers made good economic decisions
Farmers are business people. The primary asset a farmer owns or leases is land. Each year, farmers decide which crop will yield the best financial result. In many areas of the farm belt, the crops of choice are soybeans and corn. The historical price relationship between the oilseed and the grain is a basis for economical planting decisions as farmers can hedge their price risk using the futures market.
Therefore, as the snow falls over the grain belt of the US over the coming months, farmers will be watching the prices of the new-crop November 2020 soybean and December 2020 corn futures contracts.
The corn/bean ratio through history
Farmers use the corn/soybean ratio as a value guide and a barometer for which crops will provide the optimal cash flow for their acreage each year.
The semi-annual chart of the price of nearby soybean futures divided by nearby corn futures since the late 1960s shows that the average is around 2.4 bushels of corn value in each bushel of soybean value. When the ratio rises above the midpoint level, farmers tend to plant more beans than corn because the oilseed offers better relative cash flow. When the ratio falls below 2.4:1, farmers tend to plant more corn than soybeans as corn is at a higher historical value than the beans.
Watching the 2020 new crop contracts for clues – CORN and SOYB are the corn and bean ETF products
The current level of the new crop November 2020 CBOT soybeans futures contract divided by the December 2020 CBOT corn futures contract shows that as of November 20, the ratio stood at 2.4079:1, just a bit above the long-term norm.
Meanwhile, the chart shows that the new crop ratio for 2020 has been trending steadily higher since May. If the current trend continues, farmers will likely plan to plant more beans than corn on their acreage in 2020.
The new crop corn/bean ratio is a tool that helps to understand farmer planting and hedging behavior. Even though the winter months are a time when planting does not occur, hedging the next year’s crop is always a possibility.
Anyone trading or investing in the grains should start watching the 2020 corn/bean ratio over the coming weeks. The most direct route for a risk position in corn or soybeans is via the futures and futures options that trade on the CBOT division of the CME. For those that do not venture into the futures arena, the Teucrium Corn ETF product and the Teucrium Soybean ETF product provide an alternative. Each ETF holds futures contracts to replicate the price action in the grain and oilseed markets.
CORN has net assets of $85.66 million and trades an average of 72,476 shares each day. The ETF charges a 1.11% expense ratio.
SOYB has net assets of $28.33 million and trades an average of 34,669 shares each day. The ETF charges a 1.15% expense ratio.
CORN and SOYB each have approximately one-third of their respective net assets invested in the new crop 2020 corn and soybean futures contracts.
Over the coming weeks and months, those market participants looking to understand what farmers are thinking about next year’s crop should be watching the new crop corn/bean ratio.