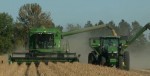
 (Reuters) – The grains market is hours away from getting an answer to one of the most important questions in agriculture: how many corn and soybean acres have the United States planted?
The U.S. Department of Agriculture’s statistics agency releases its annual acreage report on the last weekday in June at 11am CDT. It marks the agency’s first update of its views on planted crop acreage in the United States since the Prospective Plantings report in March.
For the agriculture market, June acreage is a turning point in the U.S. corn and soybean season. By the end of report day, the market will have put planted area on the back burner to focus completely on yields in the world’s leading corn and No. 2 soybean supplier.
With weather challenges expected in coming months, the market has been distracted by yield scenarios a few weeks earlier than normal, causing the conversation to drift away from area. But analysts’ latest acreage estimates vary by millions of acres, so anyone forgetting to circle back to planted area before Thursday’s report might regret it.
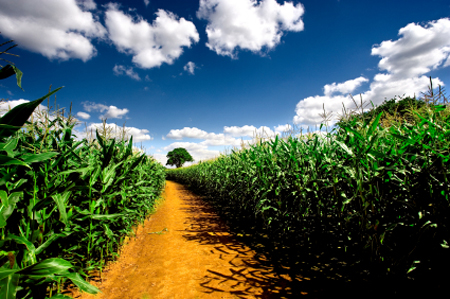
The soybean rally of recent months has the market almost certain of an increase to soybean acres over the March intentions of 82.2 million acres, potentially on an unprecedented level. This is reflected in the recent Reuters poll of industry analysts, which also expects a considerable drop in corn acres to 92.9 million acres from 93.6 million. The average trade estimate for soybeans is 83.8 million acres.
The acreage puzzle is never easy, especially this year. The price volatility in the markets throughout the spring planting campaign has thrown a level of complexity into the mix that has left even the most seasoned experts scratching their heads.
ACREAGE REPORT 101
For its June acreage report, USDA’s National Agriculture Statistics Service updates the March planted area figures primarily from tens of thousands of farmer surveys taken in the first two weeks in June. Acreage for all row crops will be given, but the market will focus primarily on corn and soybeans.
As of May 29, some 94 percent of the U.S. corn crop was planted. Soybeans were only 73 percent planted by this time, but it is difficult to believe that farmers who had not planted their intended soybeans by June 1 would change their minds.
Between 1995 and 2014, the average change from the June planted area estimate to the final figure released the following January amounted to less than 1 percent of each crop’s total. But the bias of these June estimates is even more interesting.
During this 20-year span, June acreage overestimated corn acres four times more often than it underestimated them, a split of 16 to four. The 2015 figure followed suit, as corn acreage was lowered by 1 percent between June and January.
The bias on soybeans is to still overestimate the planted area in June, but the split is less harsh at 13 to seven. However, the overestimation for the 2015 harvest was by far the most extreme of the past 21 years as the January 2016 annual crop production summary lopped off 2.8 percent of soybean acres from the June report. But higher-than-expected yield easily offset the acreage loss last year, and the market hardly felt an impact.
The directional bias from the March intentions report to June acreage is in line with the trade’s current thinking on soybeans. Over the past 20 years, USDA has increased soybean acreage 12 times between March and June (reut.rs/294fxbI).
Corn acreage has been decreased only seven times during this same period, making the historical odds against the trade, but the declining trend over the last four years gives this assumption some momentum (reut.rs/294fDjD).
According to the trade, the 2016 June acreage report could present extremes for both crops. The highest trade estimate on soybeans would have that acreage rising over March by the largest margin in the last 20 years. Similarly, the lowest trade estimate for corn represents the largest potential decrease in 20 years.
DID THE RALLY REALLY CHANGE THINGS?
The grain futures rally that began in early April has been a primary informant of the trade’s view on upcoming changes to U.S. corn and soybean planted acres. The ratio of November soybean futures to December corn futures, or SX/CZ, has been of particular interest, though it has also introduced a level of uncertainty.
SX/CZ generally represents the economic incentives for farmers to favor one crop over the other. Soybeans tend to edge corn when this ratio reaches or exceeds 2.5, which has been the case almost consistently since USDA’s planting intentions report on March 31 revealed many more corn acres than the market expected.
But as soon as the ratio began to show a solid commitment to the upside, the perfect opportunity to plant corn presented itself via Mother Nature. By May 1, national corn planting progress was 15 percent ahead of the five-year average, lending some credibility to USDA’s shockingly large March corn acreage target (tmsnrt.rs/294Asvw).
But since early May, the SX/CZ ratio has sharply fluctuated without showing a convincing increase until a few days ago. And if this flattening trend has not led to some ambivalence over price sustainability, perhaps the volatility of soybean futures is enough to leave more savvy producers wary of switching out corn acres (reut.rs/296IFCK).
Undoubtedly the enormous gain in soybean futures has allowed many U.S. farmers to market both old and new crop supply, at the very least, though for the most part it has created a lot of confusion across the grains complex.
It is important to realize that an increase to soybean acres does not automatically mean a drop in corn acres, as soybeans could have taken area from other crops instead, such as spring wheat or cotton.
WHAT IT ALL MEANS
The outcome of Thursday’s report could have drastically varying impacts on CBOT futures prices, especially if corn and soybean acreage deviate too far from the average trade estimates. And since the market seems particularly confident of a hearty rise in soybean acres, divergent news could make the rallies of recent months look like child’s play.
If soybean acres fall toward the bottom end of the trade’s range – 82.1 million acres – it could be the start of a bean bull’s dream scenario, especially if the weather forecasts soon start to suggest that trouble is ahead.
Add in lower-than-expected domestic soybean inventory from USDA’s quarterly grain stocks report, and “beans in the teens” could soon become a reality. The grain stocks report will be released simultaneously with acreage, but the trade is not really expecting surprises here. So this entire scenario could end up more a pipe dream than a reality, though nothing is impossible.
But an increase to acres, just as the market expects, could actually result in a much more stressful situation.
For one, current forecasts across the U.S. grain belt call for favorable weather through at least the first week in July. Assuming that stocks come in as expected, benign weather forecasts plus lots of bean acres would set up a fairly bearish scenario in the short term, particularly if bean acres well overshoot average expectations. This could mean that soybean futures remain stagnant or move lower in the coming weeks.
But the short-term bearish tone could extend itself if next week’s weather models still do not call for harsh weather. And the longer these models are devoid of weather troubles, the more nervous the bean bulls will become.